
Contents
1.1 Background
1.2 Purpose
of this Report
1.3 Structure
of the Report
2 Baseline Update Survey Methodology
2.1 Monitoring
Location
2.2 Methodology
3 Coral
Monitoring BASELINE UPDATE Survey Results
3.1 INTRODUCTION
3.2 REA
SURVEY RESULTS
3.3 RESULTS
OF COREL COLONY MONITORING
ANNEXES
Annex A Photographic
Records from Baseline Update Monitoring
Annex B Data
including Photographic Records from Post-Project Monitoring
1
Introduction
1.1
Background
In January,
2013, NTT Com Asia (NTTCA) installed a telecommunication cable (Asia
Submarine-cable Express (ASE) cable) approximately 7,200 km in length,
connecting Japan and Singapore with branches to the Philippines, Hong Kong SAR
(HKSAR) and Malaysia Marine works for the cable installation was completed in
January 2013. The landing site is located
at a new Beach Manhole (BMH) and the cable was ultimately connected with a Data
Centre in Tseung Kwan O (TKO) Industrial Estate. From Tseung
Kwan O, the cable extends westward approaching the Tathong
Channel. Near to Cape Collinson, the cable is approximately parallel to the Tathong Channel until north of Waglan
Island where the cable travels eastward to the boundary of HKSAR waters where
it enters the South China Sea. The
total length of cable in Hong Kong SAR waters is approximately 33.5 km. A map of the cable route is presented in
Figure 1.1.
A Project Profile (PP-452/2011) which includes an assessment of the potential
environmental impacts associated with the installation of the submarine
telecommunications cable system was prepared and submitted to the Environmental
Protection Department (EPD) under section 5.(1)(b) and
5.(11) of the Environmental Impact
Assessment Ordinance (EIAO) for the application for Permission to apply
directly for Environmental Permit (EP).
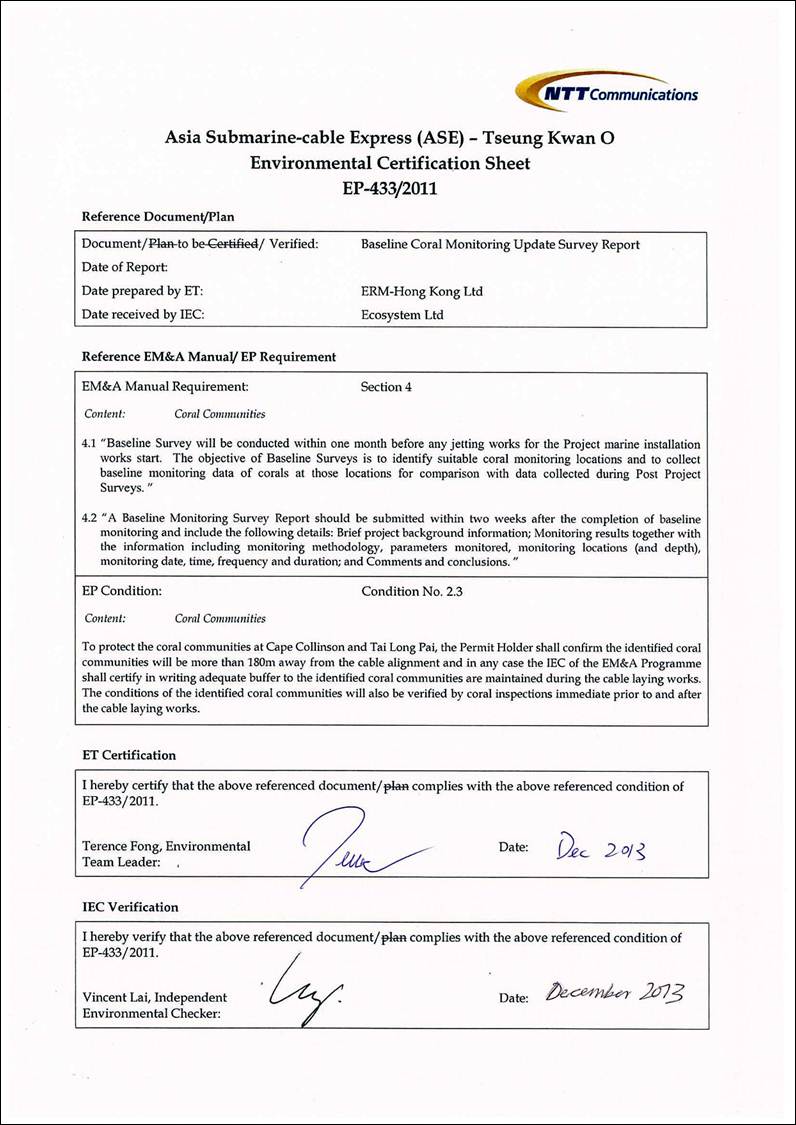
The Environmental Protection Department, subsequently issued an Environmental Permit (EP- 433/2011)
for the Project. In accordance with
the EP conditions, an environmental monitoring and audit (EM&A) programme is required to be implemented in order to track
the environmental performance of the cable installation works of the Project.
Pursuant to Condition 2.4 of the EP, an environmental monitoring and
audit (EM&A) programme, as set out in the Environmental Monitoring and Audit Manual (EM&A
Manual) ([1])
was required for this Project.
Baseline data were collected prior to the start of cable installation
works in 2012 and monitoring and audit were conducted throughout the cable
installation and after its completion in early 2013 as required in the EM&A Manual.
Upon
inspection in October 2013 the ASE cable was found to be damaged and a section
within Zone A (see Figure 2.1) requires
re-installation. The EM&A programme is therefore required to
resume for the cable installation works in Hong Kong Waters (the
��Project��). A new coral monitoring baseline
survey (Baseline Update) was proposed to be carried out prior to the
installation of the faulty section of cable. The Baseline Update survey was attempted
in November, 2013.
1.2
Purpose
of this Report
This Baseline
Update Report (��the Report��) has been prepared by ERM-Hong Kong, Limited (ERM)
on behalf of NTTCA to present the methodology and findings of the Baseline
Update Monitoring Survey conducted in November, 2013.
1.3
Structure
of the Report
The remainder
of the report is structured as follows:
Section
2: Baseline Update Survey Methodology
Presents the survey
methodology, parameters monitored, monitoring locations and depth in accordance
with the EM&A Manual.
Section
3: Survey Results
Reviews the condition
and health status of corals at the monitoring station surveyed during the Baseline
Update Survey and comparison with previous survey information in order to
determine if any detectable changes have occurred between monitoring events.
Section
4: Conclusion
Presents a
discussion of the results, comparison to previous surveys and
conclusions/recommendations.
2
Baseline Update Survey Methodology
This section
presents the methodology proposed for the November 2013 Baseline Update Survey,
which follows that of the original Baseline and Post-Project Coral Monitoring
Survey.
2.1
Monitoring
Locations
The following monitoring
locations, shown in Figure 2.1, were surveyed during the 2012 Baseline and 2013
Post-Project Monitoring:
Monitoring
Stations:
�� Zone
A: Cape Collinson; and
�� Zone
B: Tai Long Pai.
Control
Station:
�� Zone
C: Tung Lung Chau.
During the
November 2013 Baseline Update monitoring, however, only Zone A was surveyed due
to adverse conditions.
2.2
Methodology
Subtidal
dive surveys were undertaken at Zone A, which lies in close proximity to the
Project Area and focusses on the section of cable route to be replaced. The survey included the following two
components:
�� Semi-quantitative
Rapid Ecological Assessment (REA) survey; and
�� Coral
Colony Monitoring.
Each of these
surveys is described further in the following sections.
Rapid
Ecological Assessment Survey Method
A standardised semi-quantitative REA
survey technique was used to investigate the general conditions of the coral
communities--including any scleractinian
(hard), alcyonacian (soft) and antipitharian
(black) corals found--associated with subtidal hard
bottom habitat at survey site. The
REA technique allows collection of semi-quantitative information on the
ecological attributes of the subtidal habitat in a
relatively simple way without compromising scientific rigour. This technique is the standard practice
for EIA and EM&A marine ecological surveys in Hong Kong and has been
modified from the standardised REA survey technique established for the
assessment of coral communities on the Great Barrier Reef ([2]) for marine
environment of Hong Kong ([3]).
An REA survey was conducted by a qualified
coral ecologist using SCUBA with the aim of recording the condition of existing
substratum, estimating the diversity and relative abundance of coral
assemblages (ie hard corals, octocorals
and black corals) and identification of coral taxa (hard corals identified to
species level while octocorals and black corals
recorded to genus level). The
survey was undertaken along a transect placed onto the
seabed following a specific depth contour.
Only Zone A was surveyed; conditions at Zone B and Zone C were observed
to be too dangerous to conduct the survey work, and thus these sites were
abandoned. While six transects with length of 100 m each were surveyed during
previous monitoring events, only a single REA transect was surveyed in Zone A in
November 2013 due to adverse conditions at the site. Additionally, while previous monitoring
transects have been 100 meters in length, that surveyed in November 2013 was
only 75 meters in length, as surge and visibility conditions worsened beyond
that point, and further data collection was not possible. The six transects previously surveyed
were also divided between depth regions:
��
Shallow
depth region: -2 to -5 m CD (typically the depth range of hard coral colonies
associated with subtidal hard bottom habitat); and
��
Deep
depth region: -5 to -15 m CD.
However, only one, the shallow region,
was surveyed during the Baseline Update.
The transect was extended between the 3.5 and
4.0-m contour, as surge became too dangerous for data collection above this
depth.
Following the laying of the transect
line, a coral specialist swam along the transect and
conducted the REA survey. The REA
methodology encompassed an assessment of the benthic cover (Tier I) and taxon
abundance (Tier II) undertaken in a swathe ~ 1-m wide, 0.5 m either side of
each transect, due to visibility limitations. Further explanation of the two
assessment tiers implemented during the survey is presented below.
Tier
I �V Categorisation of Benthic Cover
Upon the completion of observation
along each survey transect, five ecological and seven substratum attributes
were assigned to one of seven standard ranked (ordinal) categories (Tables 2.1 and 2.2).
Table
2.1 Categories
used in the REA Surveys �V Benthic Attributes
|
Ecological |
Substratum |
|
Hard coral |
Hard Substratum |
|
Dead standing coral |
Continuous pavement |
|
Soft coral |
Bedrock |
|
Black coral |
Rubble |
|
Macroalgae |
Sand |
|
Turf Algae |
Silt |
|
|
Large boulders (>50 cm) |
|
|
Small boulders (<50 cm) |
|
|
Rocks (<26 cm) |
Table
2.2 Categories
used in the REA Surveys �V Ordinal Ranks of Percentage Cover
|
Rank |
Percentage Cover (%) |
|
0 |
None recorded |
|
1 |
1-5 |
|
2 |
6-10 |
|
3 |
11-30 |
|
4 |
31-50 |
|
5 |
51-75 |
|
6 |
76-100 |
Tier
II �V Taxonomic Inventories to Define Types of Benthic Communities
An inventory of benthic taxa was also
compiled for each transect. Taxa
were identified in situ to the
following levels:
��
Scleractinian (hard) corals to
species wherever possible;
��
Soft
corals, gorgonians, black corals, anemones and conspicuous macroalgae
recorded according to morphological features and to genus level where possible;
and
��
Other
benthos (e.g. sponges, ascidians, bryozoans, etc)
recorded to genus level wherever possible but more typically to phylum plus
growth form.
Each taxon in the inventory was ranked
in terms of abundance in the community (i.e. specific to the area surveyed, not
within the context of Hong Kong or greater region) (Table 2.3). These broad
categories rank taxa in terms of relative abundance of individuals, rather than
the contribution to benthic cover along each transect. The ranks are subjective assessments of
abundance, rather than quantitative counts of each taxon.
Table
2.3 Ordinal
Ranks of Taxon Abundance
|
Rank |
Abundance |
|
0 |
Absent |
|
1 |
Rare (a) |
|
2 |
Uncommon |
|
3 |
Common |
|
4 |
Abundant |
|
5 |
Dominant |
|
Note: (a) The classification of
��rare�� abundance refers to low abundance (small quantity) on the transect, rather than in terms of distribution in Hong
Kong waters. |
|
A set of environmental site
descriptors were recorded for each REA transect as follows:
(A) The degree of exposure to prevailing
wave energy was ranked from 1 �V 4, where:
1 = sheltered (highly protected by topographic features
from prevailing waves);
2 = semi-sheltered (moderately protected);
3 = semi-exposed (only partly protected); and
4 = exposed (experiences the full force of prevailing
wave energy).
(B)
Sediment
deposition on the reef substratum (particle sizes ranging from very fine to
moderately coarse) rated on a four point scale, from 0 -3, where:
0 = no sediment;
1 = minor (thin layer) sediment deposition;
2 = moderate sediment deposition (thick layer), but
substrate can be cleaned by fanning off the sediment; and
3 = major sediment deposition (thick, deep layer), and
substrate cannot be cleaned by fanning.
A suite of representative photographs
was taken for each REA transect.
All field data were checked upon completion of each REA transect and a
dive survey log was completed at the end of the fieldwork day. Photographs were compiled for each REA
transect which was then reviewed to verify the REA data. Verified REA data were presented in
terms of:
��
Site
(transect) information (Tier I and II data), depth and environmental descriptors;
��
Species
abundance data for each transect; and
��
Species
lists, species richness and mean values for ecological and substratum types
were compiled.
Coral Colony
Monitoring
Coral Colony Monitoring was undertaken
using the same method as during the original Baseline Survey and the first Post-Project
Monitoring Survey to identify any evidence of sediment stress to corals before
and after cable installation works of the Project. At each coral monitoring station, a
total of fifteen (15) hard coral colonies and fifteen (15) octocoral/black
coral colonies (or all colonies present if less than 15) were selected for
monitoring. Priority was given to
selecting colonies of horizontal plate-like and massive growth forms which
present large stable surfaces for the interception and retention of settling
solids. Each of the selected corals
was identified to species or genus levels and photographed. The following data were collected:
��
Maximum
diameter of the identified hard coral and soft coral colonies;
��
Maximum
height and width of the identified gorgonians and black corals;
��
Percentage
of sediment cover on the identified colonies and the colouration, texture and
approximate thickness of sediment on the coral colonies and adjacent substrate;
��
Percentage
of bleached area on the identified colonies of which two categories were
recorded: a. blanched (ie pale) and b. bleached (ie whitened);
��
Percentage
of colony area showing partiality mortality; and
��
Physical
damage to colonies, tissue distension, mucous production and any other factors indicating
to corals were noted in the field.
Although coral tagging is a common
practice for repeated monitoring of individual colony, this technique was not
employed in this monitoring programme due to difficulties in re-locating the
exact transect placement and the tagged corals given the generally low
visibility in the area and low light conditions in deep water. Instead, colonies of similar growth
forms and size were selected.
3
Coral Monitoring BASELINE UPDATE Survey Results
3.1
Introduction
This section
presents findings of the Baseline Coral Monitoring Survey Update conducted in
November 2013.
The Baseline
Update Survey was attempted in Zones A, B and C on November 7, and again
November 15, 2013. Weather
conditions on November 7 were mainly sunny, with moderate to fresh (Force 4-5)
east winds. Moderate swell, surface
chop and strong below-surface surge were experienced. Underwater visibility was extremely poor
(<0.3 m) along the northeast face of Cape Collinson
in Zone A, and a strong north current was present; this area was abandoned and
a partial REA transect was run along the south side of Cape Collinson
at the 3.5 to 4.0-m depth contour. Visibility
was slightly better here (~1 m) at the start of the transect. The line was run approximately along the
4-m contour as the surge became too strong to work any shallower than that
depth. The transect
was stopped short at 75 m, as the visibility significantly decreased and the
surge force increased along the line.
The rocks were also covered in sea urchins and barnacles, adding to the
hazard in surge and low visibility.
The divers considered it too dangerous to extend the
transect beyond this point.
Conditions continued to deteriorate throughout the dive, and the dive
was abandoned after the completion of the 75-m transect. Conditions were assessed at Zones B and
C, and found to be worse than those at Zone A; hence the survey was not
conducted at those sites.
As
monitoring was not completed on November 7, the team attempted to survey again
at Zone A on November 15. Weather was similar on the 15th,
this time with winds (Force 4) from the north to northeast. Surge and chop conditions appeared more
favorable; however, similar surge and poor visibility conditions were again
experienced underwater and the survey was abandoned without the collection of
any data due to concerns for diver safety.
Again, the conditions at Zones B and C were assessed as worse than at
Zone A, and thus no surveys were conducted at those
sites. A detailed description and
discussion of the monitoring results from Zone A, collected November 7, are presented below.
3.2
REA
Survey Results
Seabed
composition along the monitored transect within Zone A is presented in Table 3.1. Each taxon in the inventory was
ranked in terms of relative abundance in the community and results recorded
during the Baseline and Post Project Coral Monitoring Surveys are shown in Table 3.2 and 3.3, respectively.
Findings of the REA surveys are discussed below.
Zone A �V Cape Collinson
During the November 7 Baseline Update survey, the degree of
exposure within Zone A, along the northeast face of Cape Collinson
was (3) �V semi-exposed, while the south side was (4) �V exposed, thus creating
strong surge conditions nearshore. Sediment deposition on the substrate (referring
to hard substrates only) was rated as (2) �V minor, and seemed influenced by the
rough sea conditions and resultant elevated suspended sediment.
Tier
I Results
The seabed along
the transect sampled in Zone A was mainly composed of large
boulders in the shallow depth region (2-5 m CD), with some patches of sand (Table 3.1). The poor visibility did not allow for
observations of seabed between boulders, but previous surveys indicate exposed
bedrock is also present here. Some
hard and soft coral colonies were present but accounted for less than five
percent cover. Moderate cover by crustose coralline algae was also observed.
Table 3.1 Results
of REA Tier I Survey, Baseline Update (November 7, 2013)
|
Benthic Attribute |
Rank |
Percent Cover |
|
Large boulders |
6 |
76-100 |
|
Sand |
2 |
6-10 |
|
Hard coral |
1 |
1-5 |
|
Soft coral |
1 |
1-5 |
|
Crustose coralline algae |
3 |
11-30 |
The estimated
percentage covers of the major benthic attributes were similar between the
Baseline and first Post-Project Coral Monitoring Surveys, which also recorded
less than five percent hard and soft coral cover.
Tier
II Results
Both hard
coral and octocoral coverage was less than five
percent along the REA transect, which is similar to that observed during the
Baseline and first Post-Project Monitoring. Compositions of coral assemblages were
also noted to be similar to the previous surveys, with six hard coral and three
octocoral species recorded. Goniopora stutchburyi and Porites lutea were the dominant hard coral species recorded,
while Dendronepthea
sp. was the dominant soft coral species found (Table 3.2).
Table 3.2 Results
of REA Tier II Survey, Baseline Update (November 7, 2013)
|
Taxon |
Ordinal Rank |
Abundance |
|
Scleractinian (hard) Corals |
|
|
|
Cyphastrea serailia |
1 |
Rare |
|
Favia sp. |
1 |
Rare |
|
Goniopora stutchburyi |
2 |
Uncommon |
|
Oulastrea crispata |
1 |
Rare |
|
Plesiastrea versipora |
1 |
Rare |
|
Porites lutea |
2 |
Uncommon |
|
Alcyonacean (soft) Coral |
|
|
|
Dendronepthya sp. |
2 |
Uncommon |
|
Euplexaura sp. |
2 |
Uncommon |
|
Paraplexaura sp. |
2 |
Uncommon |
|
Other Fauna |
|
|
|
Anemones |
1 |
Rare |
|
Anthocidaris crassipina |
5 |
Dominant |
|
Barnacles |
4 |
Abundant |
|
Bryozoans |
2 |
Uncommon |
|
Colochirus quadrangularis |
1 |
Rare |
|
Holothuria leucospilata |
1 |
Rare |
|
Perna viridis |
2 |
Uncommon |
|
Saccostrea cucullata |
4 |
Abundant |
|
Tunicates |
1 |
Rare |
The
partial REA transect conducted November 7, 2013 was placed approximately in the
same location as A-S2 from the previous surveys. Though the number of hard coral species
observed was greater in November than in February, 2013, or during the original
Baseline monitoring, and soft coral species were fewer, it must also be
considered that a smaller area was surveyed during the November 7, 2013
monitoring (a 75-m x 1m belt transect as opposed to a 100-m by 4-m belt
transect in the shallow region).
Additionally,
the placement of transects is not exact, as water clarity and conditions at the
sites do not allow for placement of permanent transect or coral colony markers
that can be relocated for replication, and transects may not cover the exact
space or the same coral colonies each survey. Results of the Tier II Surveys conducted
during the original Baseline monitoring and Post-Project Monitoring are provided in Tables
3.3 and 3.4.
Table 3.3 Results
of Tier II Survey, 2012 Baseline Monitoring
|
Taxon/
Family |
Species |
S1 |
S2 |
S3 |
|
Scleractinian (hard) Corals |
||||
|
Siderastreidae |
Psammocora superficialis |
1 |
1 |
|
|
Dendrophyllidae |
Tubastrea/ Dendrophyllia sp. |
|
1 |
|
|
Faviidae |
Cyphastrea chalcidicum |
1 |
|
|
|
|
Oulastrea crispata |
3 |
1 |
2 |
|
|
Plesiastrea versipora |
|
|
1 |
|
Poritidae |
Goniopora stutchburyi |
2 |
|
1 |
|
Alcyonacean (soft) Coral |
||||
|
Nephtheidae |
Dendronephthya sp. |
|
2 |
4 |
|
|
Scleronephythya sp. |
|
|
1 |
|
Plexauridae |
Echinomuricea sp. |
2 |
3 |
3 |
|
|
Euplexaura sp. |
|
2 |
2 |
|
|
Menella sp. |
|
2 |
|
|
|
Paraplexaura sp. |
1 |
1 |
2 |
|
Ellisiidae |
Ellisella sp. |
1 |
1 |
1 |
|
|
Viminella sp. |
1 |
|
1 |
Table 3.4 Results
of Tier II Survey, Post-Project Monitoring (February 2013)
|
Taxon/
Family |
Species |
S1 |
S2 |
S3 |
|
Scleractinian (hard) Corals |
||||
|
Siderastreidae |
Psammocora superficialis |
1 |
1 |
|
|
Dendrophyllidae |
Tubastrea/ Dendrophyllia sp. |
|
1 |
|
|
Faviidae |
Cyphastrea chalcidicum |
1 |
|
|
|
|
Oulastrea crispata |
3 |
1 |
2 |
|
|
Plesiastrea versipora |
|
|
1 |
|
Poritidae |
Goniopora stutchburyi |
2 |
|
1 |
|
Alcyonacean (soft) Coral |
||||
|
Nephtheidae |
Dendronephthya sp. |
|
2 |
4 |
|
|
Scleronephythya sp. |
|
|
1 |
|
Plexauridae |
Echinomuricea sp. |
2 |
3 |
3 |
|
|
Euplexaura sp. |
|
2 |
2 |
|
|
Menella sp. |
|
2 |
|
|
|
Paraplexaura sp. |
1 |
1 |
2 |
|
Ellisiidae |
Dichotella sp. |
|
|
|
|
|
Ellisella sp. |
1 |
1 |
1 |
|
|
Viminella sp. |
1 |
|
1 |
|
|
|
|
|
|
3.3
Results
of Coral Colony Monitoring
Coral Colony
Monitoring was also undertaken along the REA transect. Coral colonies with similar growth forms
and size to those monitored during the original Baseline Coral Survey and Post-Project
Coral Monitoring Survey were selected and measured during the November 7, 2013
survey. Data collected for each hard and soft
coral colony are summarized in Table
3.5. Photographic
records of the assessed coral colonies are provided in Annex A.
The average
maximum diameter for hard coral colonies assessed during the Baseline Update
survey was 15.9��8.3cm, compared with an average of 12.9��11.8cm for the original
Baseline Survey and 11.3��6.1cm for the Post-Project Monitoring Survey (Tables 3.6 and 3.7). Average gorgonian
height recorded during the November 2013 survey was 45.6��16.9cm compared to
18.9��6.5cm for the Baseline survey and 21.9��7.4cm for the Baseline survey.
The majority
of hard coral colonies assessed were recorded as having one percent sediment
coverage of less than 1 mm thickness. This is comparable to sediment coverage during
both the original Baseline and the Post-Project Coral Monitoring Surveys, which
ranged between 1 and 5 percent (Tables 3.6
and 3.7). Octocorals
were generally free of sediments. Selected
coral colonies in the survey area did not exhibit any sign of bleaching,
partial mortality or any physical damage during any of the surveys.